A server can pass every health check and still be hours away from falling over. The tell for a memory leak, an out-of-memory kill or a filling disk is never a single reading — it's a trend you only see by comparing today against the last several days. This post covers how to spot each of the three before they force a restart, kill a process, or stop a write, and how to automate the watching so you don't have to remember to look.
Why these problems hide between checks
A monitor that pings your homepage every minute will tell you the site is up right up until the moment it isn't. Memory leaks, disk filling and repeated out-of-memory (OOM) kills are all rate problems, not state problems — they look completely normal on any single reading and only reveal themselves as a slope across hours or days. By the time a dashboard shows red, the server has usually already restarted a service, killed a process, or stopped accepting writes.
That's why spotting them early needs history, not just a current value: you're looking for "this number has climbed every day for a week" rather than "this number is high right now." Our guide on reading server metrics as trends versus jumps covers the general technique; this post applies it to the three failures that most often cause a 2am page.
Spotting a memory leak before the restart
A memory leak has a distinctive shape: usage climbs steadily, maybe 3-5% a day, and only drops back down when the process or server restarts. Because of that shape, a server can look perfectly healthy for days between restarts — the leak only shows up if you're watching the slope, not the current number.
On Linux, cgroup v2 exposes a memory.events file per control group with an oom_kill counter, and every process carries an oom_score that the kernel's OOM killer uses to decide what to sacrifice when memory runs out. A single climb isn't enough to call it a leak on its own — a busy week can look the same. What confirms a leak is the pattern repeating across at least two restarts, with memory reliably dropping each time.
$ free -h
              total        used        free      shared  buff/cache   available
Mem:           7.8G        7.1G        180M        210M        512M        420M
$ systemctl status myapp.service | grep Memory
     Memory: 6.8G (limit: 7.0G)
If you restart myapp.service and memory drops back to a baseline every time, you're not looking at normal load — you're looking at a leak in that specific service.
When the OOM killer starts picking off processes
When free memory runs out, the kernel's OOM killer stops a process to recover it. Whatever that process was doing ends abruptly — a database connection drops, a queue job vanishes mid-run — and the server often looks fine again immediately afterward, because the memory has just been freed. That's what makes this failure mode sneaky: it rarely shows up as sustained high memory, only as a sudden drop followed by an error somewhere else in your stack.
In containerised environments the signature is cleaner: a process killed this way exits with code 137 (128 + signal 9), and in Kubernetes the pod status reads OOMKilled. Outside containers, check dmesg for the kernel's own record:
$ dmesg -T | grep -i 'killed process'
[Tue Oct 28 02:14:11 2025] Killed process 18422 (node) total-vm:2145728kB
A handful of common exit codes worth recognising when triaging a crash:
| Exit code | Meaning |
|---|---|
| 137 | Killed by SIGKILL — often the OOM killer |
| 139 | Segmentation fault (SIGSEGV) |
| 143 | Terminated by SIGTERM — often a graceful stop |
| 1 | Generic application error |
One OOM kill can be a one-off spike. Three or more in a week on the same server is a pattern worth fixing — either give the offending service a hard memory limit so it fails predictably instead of taking others down with it, or give the server more memory. If you manage the service under systemd, pair that limit with a sane restart policy so a kill doesn't turn into extended downtime:
[Service]
MemoryMax=512M
Restart=on-failure
RestartSec=5s
Disk filling: bytes and inodes are two different problems
A disk running out of space and a disk running out of inodes look identical from the outside — writes start failing with ENOSPC, "no space left on device" — but df -h only tells you about the first one. Every file consumes one inode regardless of its size, so a disk full of small files (a cache, a mail queue, PHP sessions) can report plenty of free bytes while still being completely full:
$ df -h /
Filesystem      Size  Used Avail Use% Mounted on
/dev/sda1        40G   38G  1.2G  97% /
$ df -i /
Filesystem      Inodes  IUsed   IFree IUse% Mounted on
/dev/sda1      2621440 2621440      0  100% /
WarningA clean
df -houtput doesn't rule out a full disk. Always checkdf -itoo — an inode exhaustion fails writes exactly like running out of bytes, but a bigger disk won't fix it. Clearing out small files will.
ext4 filesystems also reserve roughly 5% of blocks for root by default (tune2fs -m), which is why df -h sometimes shows a filesystem as "full" for ordinary users slightly before it's truly out of space — that headroom exists to keep system processes writable a little longer.
Either way, the useful signal is the same as for memory: a disk that's growing at a steady rate and will hit its limit within a known number of days is a problem you can schedule around, instead of one that pages you at 3am.
Watching for all three without remembering to check
Manually running dmesg, free and df -i across every server you run doesn't scale past a handful of machines, and it relies on someone remembering to look before the problem bites. InfraNest's monitoring watches for exactly these three slow-building problems on every server running its agent, and shows each one on your Home page, the affected server or volume page, and the servers overview — not just buried in a log line.
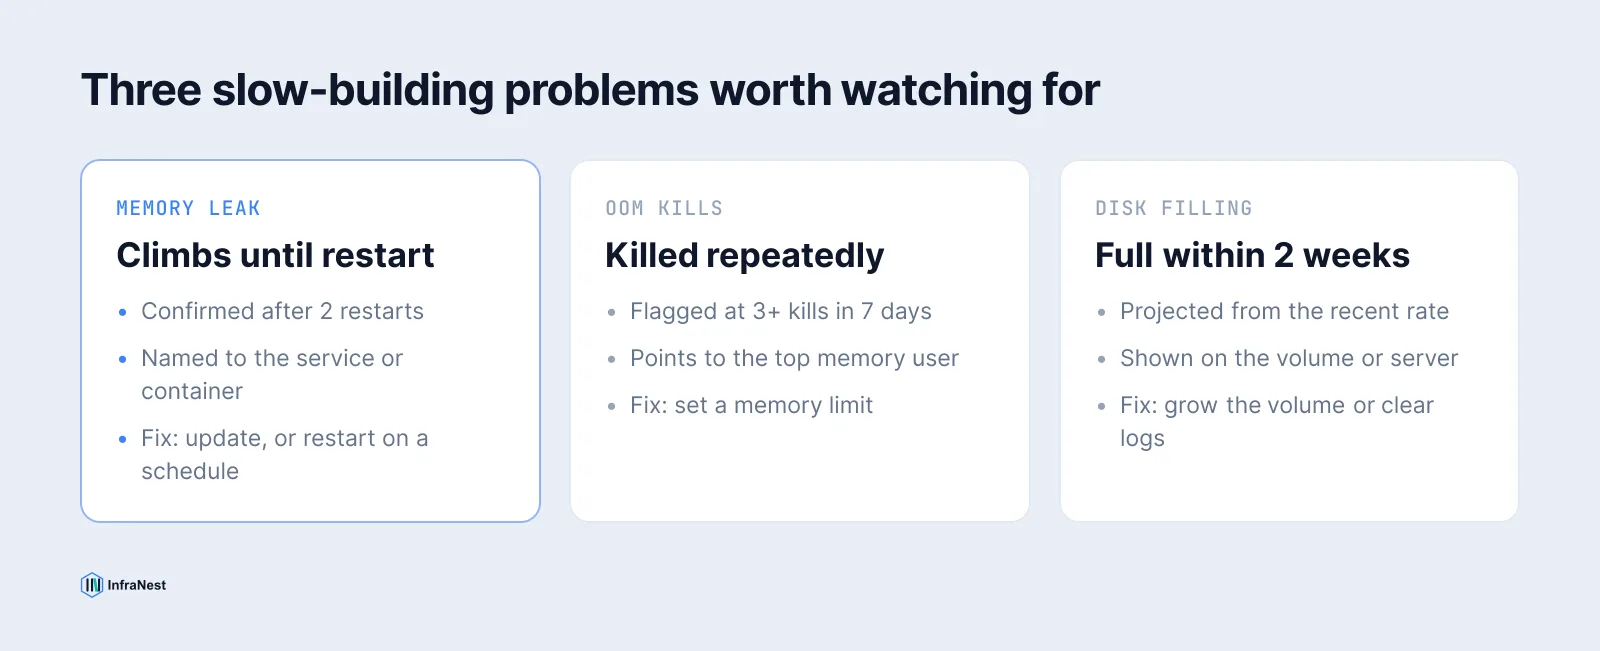
For a leak, it names the specific service or container whose memory keeps growing, once the same climb-and-reset pattern has shown up across at least two restarts. For OOM kills, it flags a server once three or more processes have been killed this way in a week, and points you straight at what's using the most memory. For a filling volume, it projects the current rate forward and lists it once it's on track to be full within two weeks — shown on the volume itself if it's a cloud volume, since that's what you'd actually grow.
That forecasting only works because it's comparing recent days, not one reading — the same principle behind reading trends versus one-time jumps in server metrics generally, and behind website and server monitoring that actually catches slow failures instead of just outages.
Fixing it: buy time, then fix the cause
- Memory leak — restarting the affected service on a schedule (overnight, say) buys time without restarting the whole server, while you ship the real fix, which is often just an update.
- Repeated OOM kills — give the worst offender a hard memory limit so it fails predictably, or add memory to the server if nothing is obviously misbehaving.
- Filling disk — grow the volume if it's a cloud disk, or clear out the usual culprits (old logs, backups, stuck queues) if it's local.
- Filling inodes — a bigger disk rarely helps; find the folder generating the most small files and clean it out instead.
None of these are emergencies if you catch them a week out. All of them are emergencies if you catch them when the disk is already full or the service is already down.
If you're setting this up for a fleet rather than one box, see your servers together with their monitors so a slow leak on one machine doesn't need a separate investigation from the outage it eventually causes.
Ready to stop finding out from a customer? Set up server monitoring and let it flag the leak, the kill pattern and the filling disk before any of them cause downtime.
Frequently asked questions
#How many restarts does it take to confirm a memory leak?
A single climb in memory isn't enough — a busy week can look the same as a leak. The reliable signal is the same climb-and-reset pattern repeating across at least two restarts of the service or server, with memory consistently dropping back to a baseline each time.
#Why does a disk show free space but still fail to write?
The disk has likely run out of inodes, not bytes. Every file uses one inode regardless of size, so a disk full of small files such as cache entries or session data can report plenty of free space in df -h while df -i shows 100% used.
#What exit code means a process was killed for lack of memory?
On Linux, a process killed by the out-of-memory killer typically exits with code 137 (128 plus signal 9, SIGKILL). In Kubernetes, the pod's status additionally shows OOMKilled for the same event.
#Does catching these problems require installing anything on the server?
Memory, disk space and OOM-kill history generally aren't exposed by a cloud provider's own API, so detecting them reliably needs an agent running on the server itself rather than relying on provider metrics alone.
Try it with a free tool
Was this article helpful?