

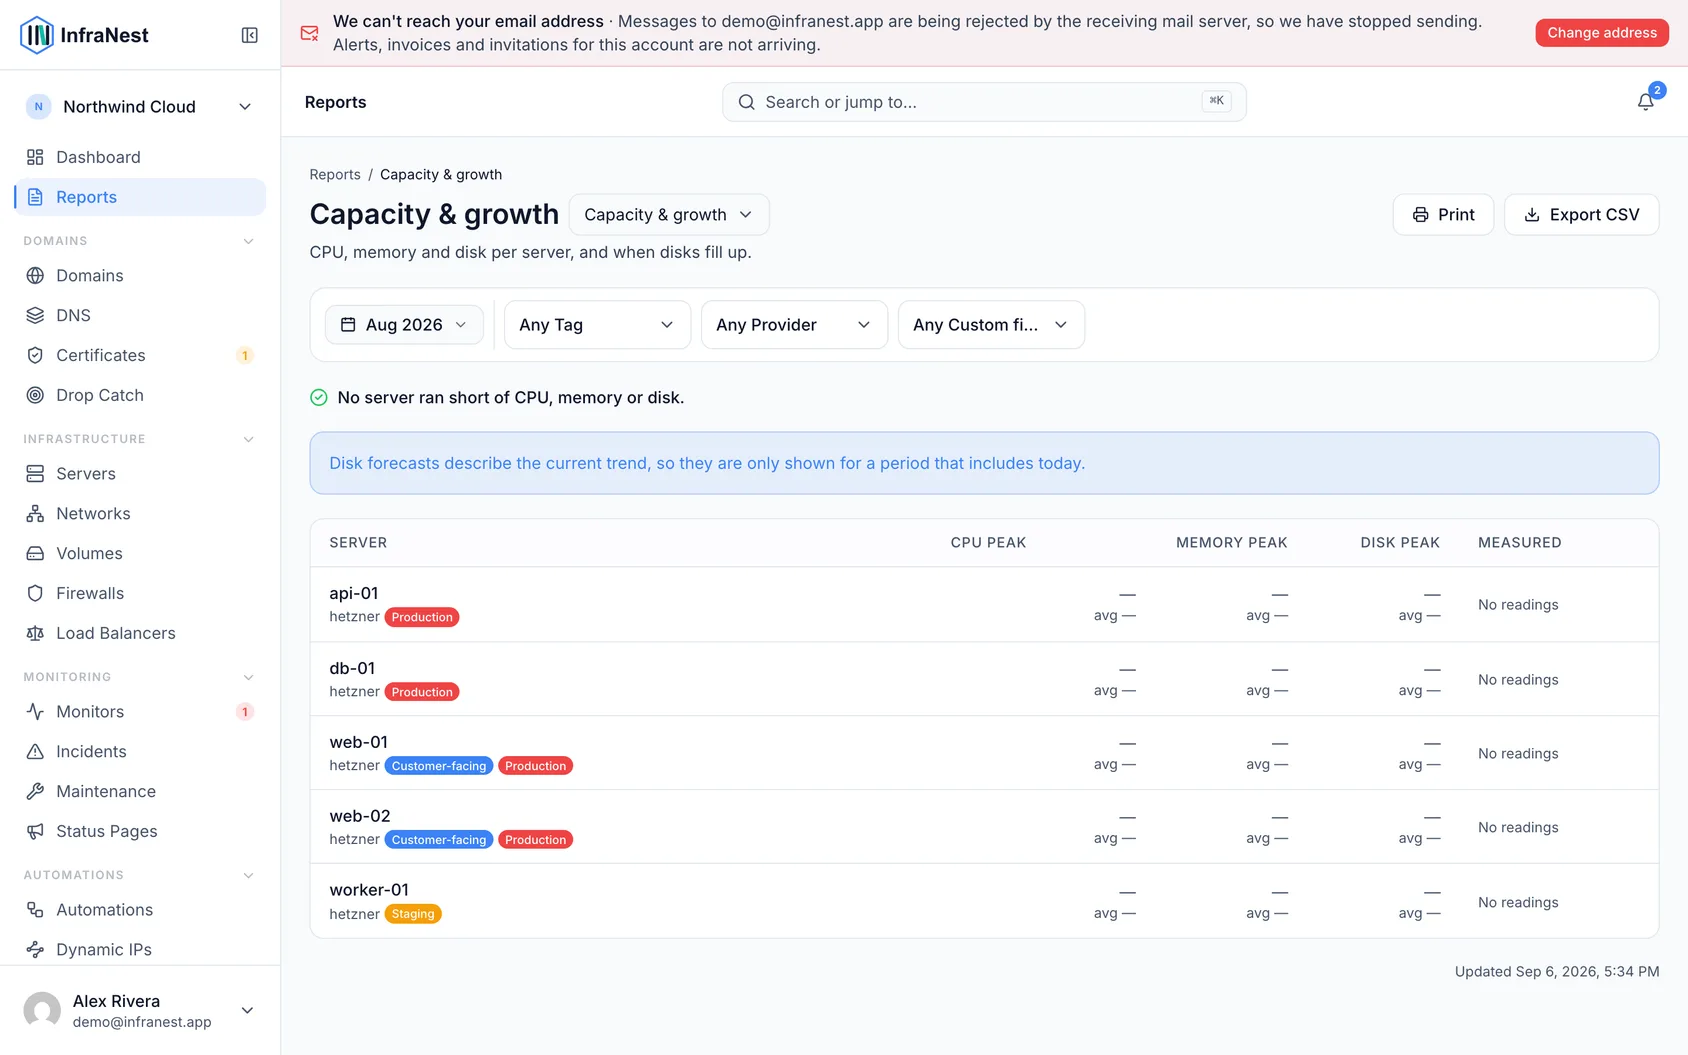
See at a glance which servers are stretched on CPU, memory or disk, and which disks are about to run out of space — built for anyone deciding what needs resizing.
Overview
- Shows CPU, memory and disk for every server in your fleet over a month you choose, side by side.
- Highlights disks that are steadily filling up, with a rough time-to-full estimate.
- Unlike a single server's own page, this report covers your whole fleet at once, which is what you want when comparing servers and deciding what to resize.
Read a row
- Look at the peak figure for the month — this is the highest the server hit.
- Check the average underneath it — this is the typical level.
- Glance at the small line next to the numbers to see the shape of the month at a glance.
- Watch for colour: numbers turn amber above 75% and red above 90%.
NotePeak and average together tell you something neither does alone. A server sitting at a steady 60% and a server with one bad afternoon can show the same average, but only the peak reveals the spike.
Understand "12 of 31 days"
- Check the days-measured note on each row before comparing servers against each other.
- If a server shows a low count out of the month's total, treat it as a partial reading rather than a full picture — it may have been added part-way through the month.
- If a row shows "No readings", read that as no data received, not as zero usage.
Check disk forecasts
- Look for a note like "full in ~9d" next to a disk that's on a steady filling trend.
- Remember this forecast is based on the last week of readings, so it only appears for a period that includes today.
- Don't expect a forecast on every disk — one-off dumps or caches that fill and empty aren't on a steady trend, so no forecast is shown for them.
TipIf a disk you'd expect to see a forecast for doesn't have one, it likely means its usage pattern isn't steady enough to project safely — that's by design, not a bug.
Export the report
- Select Export CSV to download the month exactly as shown, including the days-measured columns so the figures can be checked later.
- Know that every export is recorded in your Audit Log for accountability.
Was this article helpful?
Related articles
Set alert rules once for every serverAn alert default is a rule you set once for your whole organisation. Every server you have switched monitoring on for follows it, and any single server can…Install the server agent, step by stepThis walks through installing the InfraNest agent on one server, from getting a token to seeing the numbers arrive. It takes about two minutes per server.Get memory, disk space and load with the agentYour provider can tell us how busy a server is. It cannot tell us how much memory is left, how full the disk is, or which process is eating the machine…Server metrics and alertsInfraNest collects each server's CPU, network and disk metrics, shows them as graphs, and can alert you when something stays over a threshold for too long.