

See your servers' CPU, network and disk activity as graphs, and get notified when something stays over a limit for too long. This is for anyone keeping an eye on server health without needing to be a monitoring expert.
Overview
- InfraNest collects each server's CPU, network and disk metrics automatically and shows them as graphs.
- You can set alert rules so InfraNest tells you when a metric stays too high for too long.
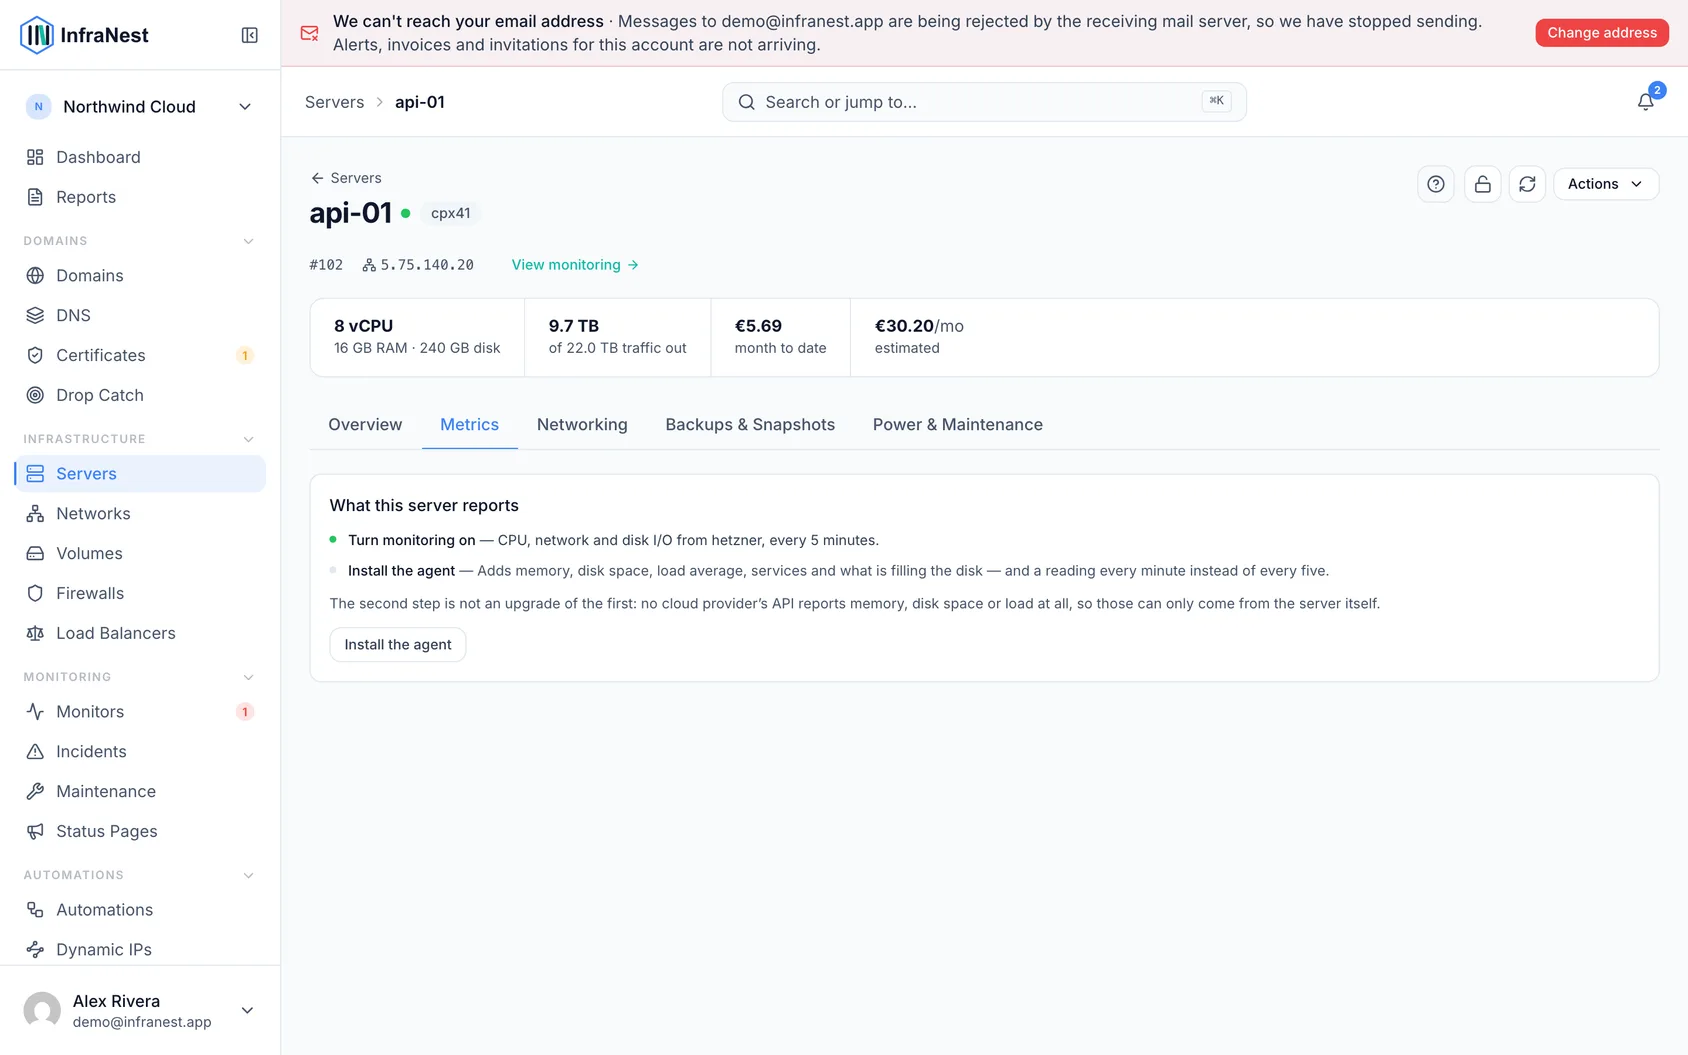
- Memory, disk space and load average need the server agent installed, since your provider does not report them.
- When a service on the server fails, InfraNest tells you why in plain language, without ever reading your logs.
See the metrics
- Go to Monitors to see every server at a glance.
- Open a server to see its own monitoring page, with live CPU, network in/out, and disk read/write graphs, plus disk space and what is running.
NoteA server has to have monitoring switched on before anything is collected about it. Until then, it's listed but no data shows.
Memory, disk space and load average aren't shown by default — your provider's API doesn't report them. They only exist on the server itself, so rules on those metrics stay greyed out until the agent is installed.
Where alert rules come from
Most rules are set once for your whole organisation under Alert defaults, and every server inherits them. On a server's alert list, those show as Org default.
If one server needs different numbers — a build machine that's meant to run hot, say — change the rule there and it becomes Overridden here, affecting only that server. Use Reset to put it back on the organisation's rule. You can also add a rule that exists on one server and nowhere else.
Switching an organisation rule off switches it off everywhere, including on servers that had customised it.
Set up an alert
- On the server's monitoring page, open Alert rules and select Add metric alert.
- Choose the Metric (CPU, network in/out, or disk read/write), a threshold, and how long the breach must last.
- Select Save.
The duration is the window InfraNest averages over, not a stopwatch. It takes the average of the metric across those minutes and alerts only if the average is past your limit — so a one-minute spike from a backup or a scheduled job won't wake anyone, while genuinely sustained load will. When it fires it opens an incident and notifies your alert destinations.
Once an alert has fired, the metric has to come back clearly below your limit (about 10% under it) before it's called recovered. That stops a value hovering right on the line from alerting and recovering over and over.
What you'll be sent
You get at most two messages per alert:
- When it fires — the value now, the limit you set, and how long it has been over it.
- When it comes back to normal — an all-clear that says how long the value stayed over the limit. Nothing needs doing; it just closes the first message.
If a spike is too short to trigger the alert, you hear nothing at all — not even an all-clear, because there was no alert to close. The incident resolves automatically when the metric recovers.
NoteThese incidents live alongside your uptime-monitoring incidents, so server health and service uptime are in one place.
If you install the agent
Nothing here changes — thresholds, durations, recovery behaviour, incidents and notifications all work the same way. You simply get more metrics to write rules about, a reading every minute instead of every five, and the option of an alert for a server that stops reporting at all.
Removing the last agent token puts the server straight back on provider metrics. InfraNest tells you when this happens, because the rules that only the agent can measure stop being measured at that moment.
When a service fails, we tell you why
If you have installed the agent, the Services tab lists what is set up to run on the machine, and puts anything that has failed at the top.
A failed service shows why it failed, in plain language, next to the name:
| What you see | What happened |
|---|---|
| Ran out of memory | The system killed it to free memory. Usually the machine is too small for what is running on it, or the service has a leak. |
| Stopped with an error | It exited on an error of its own. The error code is shown beside it. |
| Took too long and was stopped | It did not finish starting, or shutting down, inside the time it was given. |
| Failed too often to keep retrying | It kept restarting and gave up. Something is wrong that a restart does not fix. |
| Stopped responding | It stopped checking in, so it was restarted. |
| Crashed | It stopped unexpectedly and left a crash file behind. |
| Could not get what it needed to start | Something it depends on was missing — a file, a port, a device. |
This is usually enough to tell you what to do next: "ran out of memory" points at the server's size, "could not get what it needed to start" points at configuration.
Why we don't show the service's log
InfraNest deliberately does not send your services' log output into the system, and has no plans to.
Logs routinely contain passwords and access keys — a database connection string in a startup error, a token in a failed request. Copying them off your server and into InfraNest would put your credentials somewhere they don't need to be, and no amount of filtering can reliably tell a secret from ordinary text in an arbitrary program's output.
The failure reason shown in the Services tab answers the question the log was going to answer, without any of that leaving your machine.
To read the log itself, use the machine you already trust: log in over SSH and run
journalctl -u name-of-the-service --since "1 hour ago"
The service name shown in the Services tab is exactly what goes after -u.
Troubleshooting
- A rule stays greyed out — that metric needs the agent installed on the server; provider metrics alone can't measure it.
- No alert fired for a spike you saw on the graph — the spike was likely shorter than the duration you set, so its average never crossed your threshold.
- You didn't get an all-clear — that means no alert ever fired for that dip in the first place, so there was nothing to close.
Was this article helpful?