

This article is for anyone who needs to send a client or manager a fixed, final uptime figure for a monitor — the kind of number that doesn't change after you've sent it.
Overview
- Shows uptime for a single calendar month, per monitor, so the figure is final once the month ends.
- Unlike the rolling uptime shown on the Monitoring page or your status page, a monthly figure never moves once the month is over — making it safe to put in a contract or send to a client.
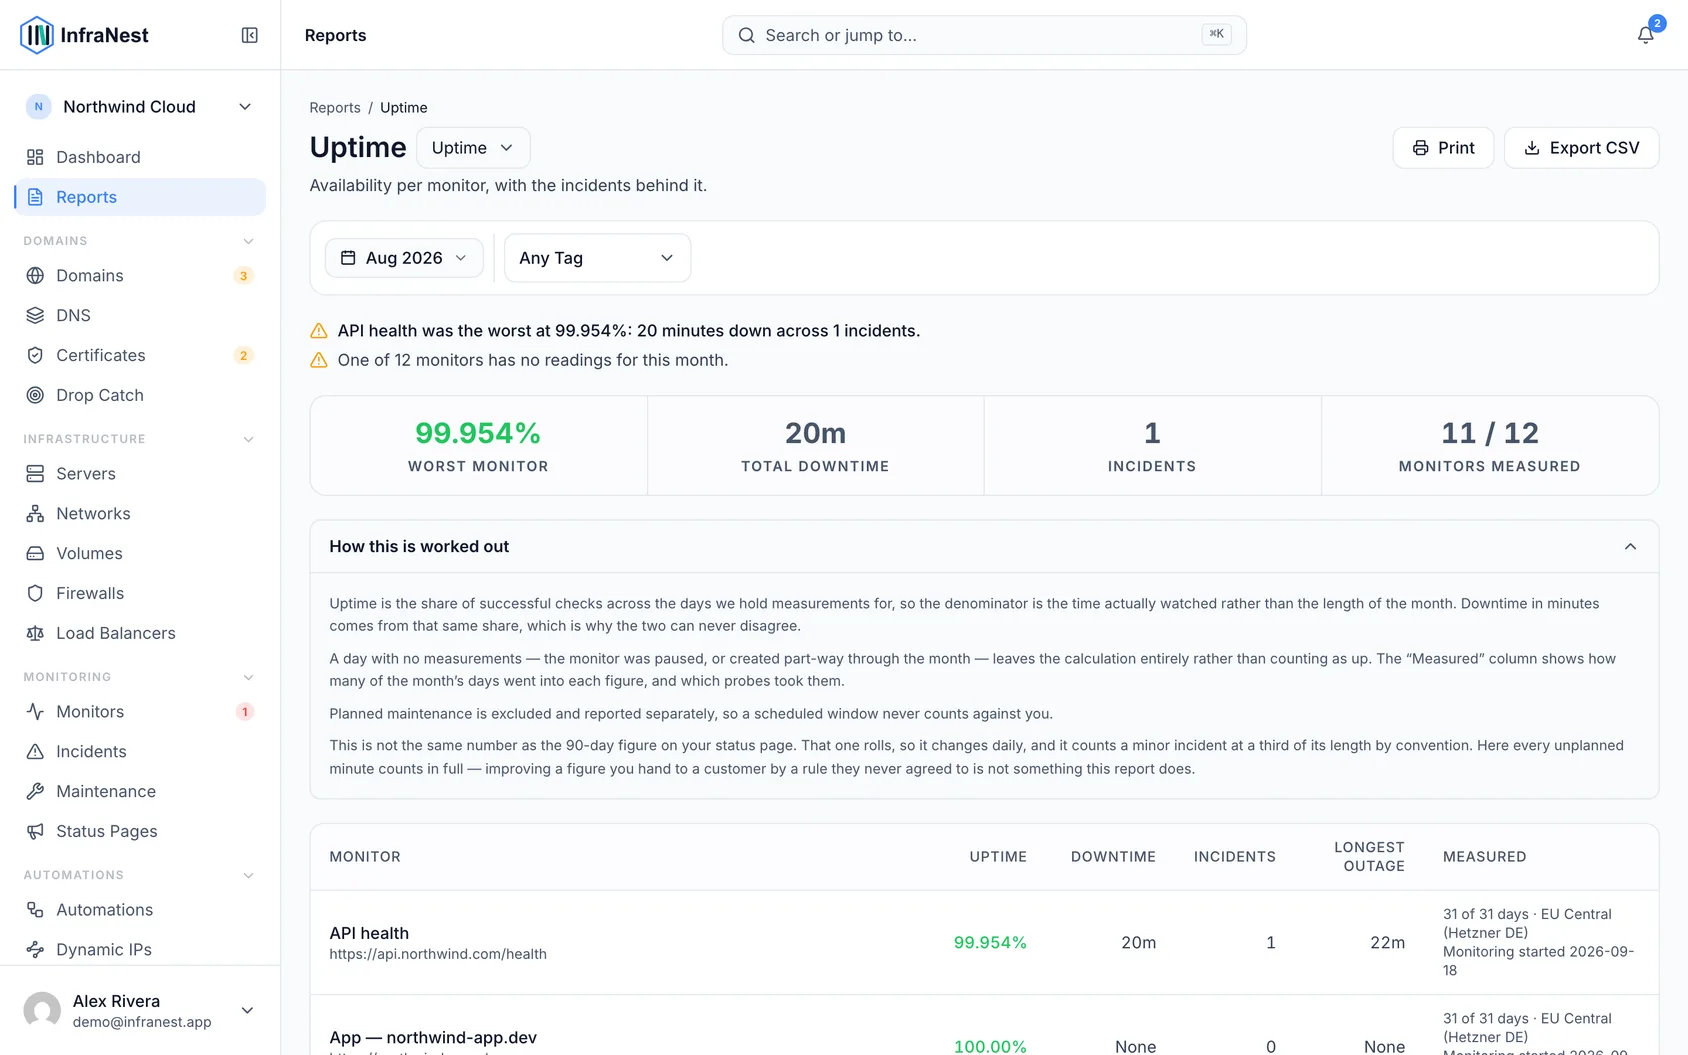
- Breaks each month down into Uptime, Downtime, Incidents, Longest outage, and Measured, so the number comes with the context needed to back it up.
- Lets you export the figures as a CSV to send on or keep on file.
Why a month, and not "the last 30 days"
The uptime column on the Monitoring page, and the bars on your status page, both cover a rolling window. That's right for a status page, but wrong for a promise — "99.94% over the last 30 days" is a different number tomorrow, so it isn't something anyone can hold you to, or that you can point at later.
An SLA is stated per calendar month. Once July ends, July's figure is final.
Pick a month
- Open Uptime report.
- Use the month picker in the top right, or click any row in the Last 12 months table.
- The page opens on the most recently finished month by default, since that's the newest one whose numbers are settled.
NoteIf you pick a month that hasn't ended yet, the page will tell you those figures can still move. They're still real numbers covering the days so far — the Measured column shows how much of the month they're based on, and today only counts up to the current hour.
Read the report
Each row covers one monitor for the selected month:
- Uptime — the share of successful checks, shown to three decimals. 99.9% and 99.94% are different promises, so the figures aren't rounded together.
- Downtime — how long the monitor was down, in hours and minutes.
- Incidents — how many separate unplanned outages occurred.
- Longest outage — the single worst stretch, since one long outage is a very different month from twenty short ones adding up to the same total.
- Measured — how many of the month's days went into the figure, and which probes took the readings.
How the figure is calculated
The denominator is the time actually watched, not the length of the month.
- A day with no measurements — the monitor was paused, or created part-way through the month — drops out of the calculation entirely. It's never counted as "up". The Measured column shows this, for example, as "12 of 31 days".
- A monitor with no measurements at all shows "—", not 100%.
- Planned maintenance is excluded and reported separately on the row, so a scheduled window never counts against you.
Why this doesn't match your status page
Two deliberate reasons:
- Different window. The status page rolls over the last 90 days and changes daily. This report covers one fixed calendar month.
- No softening. Status pages conventionally count a minor incident at about a third of its length. This report counts every unplanned minute in full.
So the monthly figure is usually the lower of the two — and it's the one that's safe to put in writing.
Send it to a client
- Pick the month you need, as above.
- Click Export CSV.
- The download includes one row per monitor, with the uptime, downtime, incident count, longest outage, and days-measured basis all in the same file.
TipThere's no PDF option. If you need one, open the CSV in any spreadsheet and print from there.
Every export is recorded in your Audit Log.
Troubleshooting
- A monitor shows "—" instead of a percentage — this means there were no measurements at all for that monitor in the selected month, so no figure can be calculated.
- The figures for the current month keep changing — that's expected. Only finished months are final; the current month updates as the days go by.
- The percentage doesn't match my status page — this is intentional. See "Why this doesn't match your status page" above.
Was this article helpful?